
AI Visibility Sample Size: How Many Prompts and Runs

On this page
Every AI visibility dashboard shows a line going up or down. The question this page answers is when that line means something: how many prompts, engines and days of data you need before a change in AI visibility is a trend rather than noise. The numbers come from our own measurement infrastructure, which tracks about 180 prompts across 6 engines daily, and from a paired-run experiment on citation variance.
How many samples do you need before an AI visibility trend is real?
You need enough answers that the confidence interval around your visibility rate is smaller than the change you want to claim, so the right AI visibility sample size is measured in hundreds of answers per comparison period, not dozens. The arithmetic: a visibility rate near 25% measured over 72 answers carries a 95% confidence interval of about ±10 percentage points; over roughly 300 answers it tightens to about ±5. To say “visibility moved from 20% to 30%” with standard statistical power, you need about 294 answers in each period. One prompt checked daily gives you 7 answers a week, which resolves nothing.
Independent AI visibility sample size math lands in the same place. Gumshoe’s sample-size walkthrough puts a single prompt on a single model at 97 runs for ±10 points and 385 for ±5, and shows that 10 related prompts run 39 times each or 50 prompts run 8 times each both reach ±5 points.
The good news is that answers multiply fast: prompts × engines × days. Fifty prompts across 6 engines sampled once a day is 2,100 answers a week. At that volume a week-over-week comparison is statistically sound, and a day-over-day one still is not, because a single day of the same setup is only 300 answers spread across engines that behave differently.
Three practical rules set the AI visibility sample size for any dashboard:
- Compare periods. Weekly aggregates are the smallest sound unit for a mid-sized prompt set.
- Never pool engines into one rate. Each engine has its own citation behavior, so a pooled number describes none of them. Read per-engine rates and let each carry its own interval.
- Size the read to the claim. The AI visibility sample size a 2-point move needs is several times larger than what a 10-point move needs. If the dashboard cannot supply the volume, the honest report is “no detectable change”.
Why one AI answer proves nothing
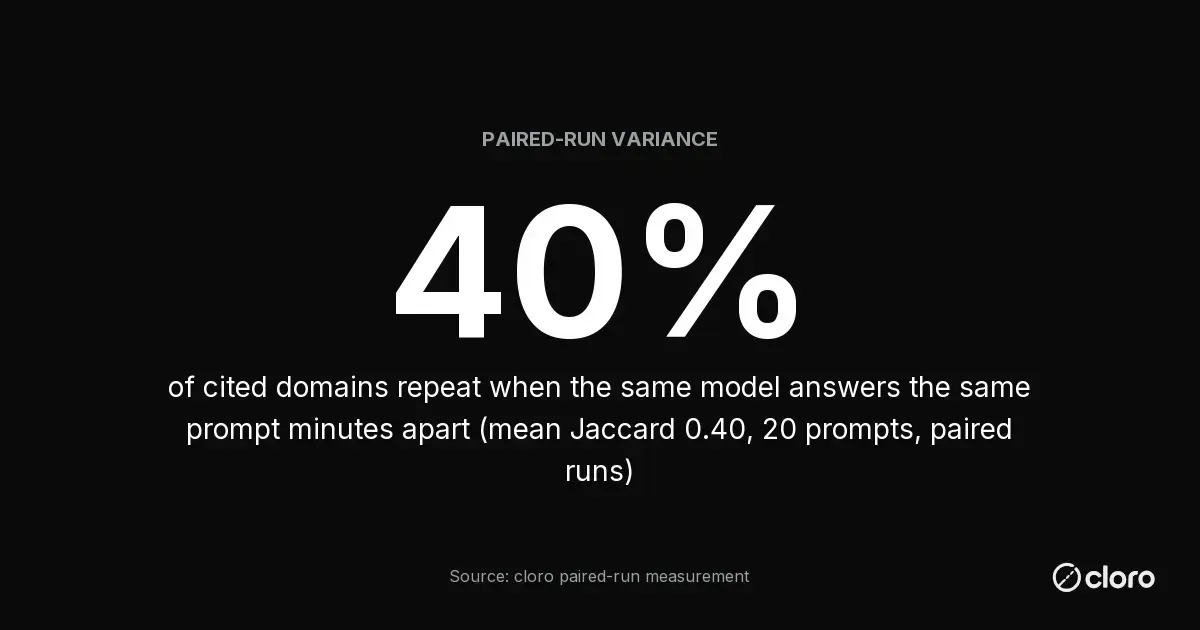
Citation is probabilistic per answer, and we measured how probabilistic. We
ran the same 20 prompts through the same model (claude-sonnet-5 with web
search enabled) twice, minutes apart, and compared the cited domains per
prompt. The mean overlap was 0.40: the identical model answering the identical
prompt repeated only about 40% of its cited domains on the second run.
Per-prompt overlap ranged from 0.06 to 1.00.
Model tier moved the numbers further. Across the same prompts,
claude-haiku-4-5 averaged 4.0 sources per answer, claude-sonnet-5 6.5, and
claude-opus-5 8.8, and cross-tier domain overlap fell to 0.22 to 0.25,
roughly half the same-model ceiling. Bigger models cite more sources per
answer, which means more citation slots, and different tiers draw from
measurably different source pools. The sample was small (20 prompts, one
day), so treat the exact figures as indicative; the instability they
demonstrate is the durable finding.
The consequence for measurement: a brand can be genuinely “visible” on a prompt and still be absent from any single answer, because each answer is one draw from a pool of plausible sources. Screenshots are anecdotes; presence is a rate over many draws, which is why the sample-size math above exists at all. It is also why being in the engine’s candidate pool across many related queries beats optimizing for one prompt’s answer.
How do you sample AI answers often enough to separate signal from noise?
Sample every prompt on every engine on a fixed daily cadence, and read the results as weekly rates per engine. The cadence matters less than its regularity: a prompt sampled daily gives you a clean 7-answer weekly cell, while ad-hoc sampling produces cells of uneven size that bias any comparison toward whichever week you sampled harder.
The setup we run and recommend:
- One run per prompt per engine per day. Predictable volume, and every week is comparable to the last.
- Aggregate to visibility per engine per week. Mentions divided by answers, with the answer count as the denominator you report alongside.
- Hold the prompt set stable inside a measurement window. Adding prompts mid-window changes the denominator and manufactures a trend. Batch prompt changes, and date them.
- Alert on aggregates, not single answers. “Visibility below 15% for 7 consecutive days” is actionable; “we were not in this morning’s answer” is noise, per the variance numbers above.
The budget for that cadence is smaller than most teams expect. On cloro’s published pricing, one daily run of 50 prompts across all 6 engines costs about 1,300 credits a day (engine costs range from 3 to 5 credits per answer), roughly 39,000 credits a month. That is $15.60 at the Hobby tier ($100 a month for 250,000 credits, $0.40 per 1,000), so the constraint on sample size is rarely money.
If budget forces a choice between more prompts and more daily runs per prompt, take more prompts: variance between prompts is larger than variance within one, so breadth buys more statistical information than depth.
What is a good AI visibility score?
There is no universal good score, because every score depends on its denominator: which prompts, which engines, which dates. Nick Lafferty’s metrics reference makes the point with his own number, a 0.50% citation share of a 48,589-citation topic window, which is a different claim from 0.50% of ten hand-picked prompts. Vendor bands exist: per Campaign Creators, HubSpot’s diagnostic tool reads 70 to 100 as well represented and 40 to 69 as the range where most mid-sized businesses land. Read any band as a comparison against your own frozen baseline, with its answer count and interval beside it. A score from a 20-answer sample has an interval too wide to place it in any band, so check the AI visibility sample size before the score.
How many prompts do I need to track AI visibility properly?
Enough to cover every distinct buyer intent you care about, which for most brands lands between 50 and a few hundred prompts. Distinctness is the real constraint: ten phrasings of “best rank tracker” are one intent sampled ten times, useful as extra samples of one intent, never as extra coverage. Build the set from intents (categories you sell into, competitor comparisons, problem phrasings, how-to questions around your product) and let phrasing variants be deliberate replicas rather than accidental filler.
The market has converged on the same order of magnitude: Peec’s published plans cap tracked prompts at 50, 150 and 350 with daily tracking across 3 models, and Profound sells prompt-volume data described as what millions of people ask AI. Trackers like Otterly sit in the same range. Our own tracked set is about 180 prompts, tagged by motion, across 6 engines.
A cap changes strategy: a 50-prompt plan is a sample of your intent space rather than the space itself. Spend it on the intents where a citation is worth money, and accept that the long tail goes unmeasured until the budget grows.
Can I monitor AI answers continuously instead of once a day?
You can, and for most of a prompt set it buys surprisingly little, because the constraint is statistical rather than mechanical. Sampling the same prompt hourly instead of daily multiplies your answers per cell by 24, which tightens a weekly confidence interval by about a factor of five (intervals shrink with the square root of the sample). That is real, and for most brand questions a weekly read at daily cadence is already sound; the extra spend mostly resolves differences too small to act on.
Where continuous sampling earns its cost is a small, specific subset:
- Crisis-sensitive prompts. Questions where a wrong or hostile answer costs money by the hour justify hourly runs, because there the goal is detection latency, not a tighter interval.
- Fast-moving engines. Surfaces grounded in real-time content shift intra-day, and a daily sample aliases that movement.
- Event windows. A launch, a pricing change, or a press cycle is worth a temporary high-frequency lane, dated so the burst does not contaminate the trend series.
The pattern that fits most budgets is two tiers: the full prompt set daily, a small crisis subset hourly. On cloro’s pricing, moving 10 prompts from daily to hourly across 6 engines adds about 179,000 credits a month (23 extra runs a day at roughly 26 credits per 6-engine sweep), most of the Hobby tier’s volume, so promote prompts to the hourly lane deliberately rather than by default. Dashboard products make the same trade: Semrush’s AI share-of-voice guide runs on scheduled tracking rather than continuous polling, for the same reason.
How do I get alerted when my brand disappears from ChatGPT answers?
Alert on a run of misses long enough that chance cannot explain it, and never on a single missing answer. The variance numbers above set the bar: if your brand normally appears in half of a prompt’s answers, three consecutive daily misses on one prompt still happens by chance more than one day in ten, which as an alert would page you weekly about nothing.
The alert design that survives the math:
- Define presence per prompt per engine per day, from the answer’s text and sources, then aggregate to the rate the alert watches.
- Alert on windows, not answers. “Mention rate across the prompt group below 15% for 7 consecutive days” fires on real disappearance; “absent from this morning’s answer” fires on the 40% domain churn we measured between paired runs minutes apart.
- Scale the window to the prompt’s volume. A brand tracked on one prompt needs a longer run of misses than one tracked on twenty, because twenty prompts a day is twenty draws and the aggregate stabilizes faster.
- Route engine-wide drops differently. If every brand’s rate falls on one engine at once, the engine changed behavior; that alert belongs to whoever owns the measurement, not to the brand team.
Alerting is where owning the raw answers pays off directly: thresholds like these are three lines of SQL over stored responses, whereas a dashboard’s alert ships with whatever sensitivity the vendor chose.
A four-week measurement plan that respects the math
Putting the numbers above into a calendar makes the discipline concrete. This is the plan we would hand a team starting from zero:
- Week 0: freeze the instrument. Write the prompt set (say 60 prompts across your intents), pick the engines, fix the competitor panel, and date the file. Nothing in it changes for four weeks.
- Weeks 1-2: baseline, in silence. Run daily, report nothing. Two weeks at 60 prompts across 6 engines is 5,040 answers, enough to put a ±5-point interval on rates near 25%. Resist reading day charts; they are the noise the plan exists to average over.
- Week 3: first read. Compute per-engine weekly rates with their denominators. This is the number every later week is compared against, so store the raw answers behind it, not just the rates.
- Week 4: second read, first comparison. Week-over-week deltas now have two real points. A delta smaller than the interval is reported as “no detectable change”, in those words; the discipline of saying so is what keeps the bigger claims credible later.
- After week 4: intervene one variable at a time. Ship the content change, the PR push, or the new pages, date the intervention, and judge it against the frozen baseline no earlier than two weeks after it lands. An intervention inside the baseline window restarts the baseline; that rule has no exceptions that leave the data readable.
The cost of the whole four weeks at this size is about $17 on cloro’s published pricing (10,080 answers at roughly 4.3 credits each is about 43,000 credits, at $0.40 per 1,000), which is worth stating because the expensive part of measurement is never the data: it is the month of restraint.
How do I choose which prompts to monitor for AI search?
Choose prompts the way you would choose keywords for commercial intent, then verify each one actually retrieves in the engines:
- Start from buyer questions. “Best X for Y” and “X vs Y” prompts decide purchases, while “what is X” prompts mostly retrieve encyclopedias.
- Write prompts as users type them. Full questions rather than keyword strings. Engines rewrite prompts into their own search queries (we measured how often in the ChatGPT grounding frequency study), and conversational phrasing survives that rewrite better.
- Cover each intent once, then add deliberate variants. Mark which prompts are replicas so your dashboard can treat them as extra samples of one intent.
- Verify retrieval before you commit budget. Run a candidate prompt a few times and look at what the engines actually pull. A prompt whose answers never touch your category cannot measure you, whatever its phrasing suggests.
- Date every change to the set. The prompt list is your instrument; recalibrating it mid-experiment invalidates the read, whatever the AI visibility sample size was.
For what to do once the measurement says you are invisible, start with what gets cited in AI answers, and if you want the raw per-answer data in your own stack instead of a dashboard’s weekly rollup, that is what AI visibility tracking with cloro returns: the answers, sources and citations per prompt, so the sample-size math above runs on your side with nothing hidden.

About the author
Ricardo Batista
Founder, cloro
Ricardo is one of the founders and engineers behind its SERP and AI-search scraping infrastructure. Before cloro he scaled a financial comparison site to $7M ARR and ran the full-country operations of a unicorn to $65M ARR, then went back to building. He writes about search engine scraping, generative-engine optimization, and turning live search and AI-answer data into something teams can act on.
Frequently asked questions
What is a good AI visibility score?
There is no universal good score, because every score depends on its prompt set, engines and dates. Vendor bands exist (HubSpot's diagnostic tool reads 70 to 100 as well represented and 40 to 69 as where most mid-sized businesses land), but a score is only meaningful against your own frozen baseline, reported with its answer count and confidence interval.
How many samples do you need before an AI visibility trend is real?
Enough answers that your confidence interval is smaller than the change you claim. Around 300 answers per period resolves a visibility rate to roughly ±5 percentage points, and detecting a move from 20% to 30% visibility needs about 294 answers in each period. At 50 prompts across 6 engines sampled daily, you collect 2,100 answers a week, so week-over-week reads are sound and day-over-day reads are noise.
Why can't a single ChatGPT answer tell me if my brand is visible?
Because citation is probabilistic per answer. In paired runs we measured, the same model answering the same prompt minutes apart repeated only about 40% of its cited domains. A single answer is one draw from a pool of plausible sources, so presence in one screenshot proves neither presence nor absence in general.
How many prompts do I need to track AI visibility properly?
Between 50 and a few hundred distinct prompts, depending on how many buyer intents you serve. Coverage of distinct intents matters more than raw count: ten phrasings of one question are one intent sampled ten times. Tool tiers cluster in the same range; Peec's published plans cap tracked prompts at 50, 150 and 350.
Related reading
What Gets Cited in AI Answers? Query Type Beats Topic
AI engines cite a source on 91% of 'best X' answers but only 81% of definitions. That 10-point swing is driven by query intent, not subject. Across eight verticals citation presence stays in a tight 82–88% band. If you want to be cited, the shape of the question you answer matters more than the industry you're in.
How to Track AI Search Visibility Programmatically
AI engines ship no dashboards, so you query them yourself. A developer's guide to tracking AI search visibility: brand mentions, citations, and share of voice.